我国每年产后粮食在储运加工环节损失 3 500 万t,相当于2 亿人一年的口粮,其中有大量粮食因储粮害虫的取食和污染而亏损,因此害虫防治一直是我国粮食仓储管理中的重要任务[1]。我国储粮害虫的防治工作遵循有害生物综合治理(Integrated pest management,IPM)策略,而害虫密度监测是其中一个重要环节,及时发现并处理虫情有助于控制虫害和大幅降低粮食损失,并节省防治成本[2-3]。我国传统的粮仓虫害检测方法是人工扦样法,该方法的缺点是费时费力,且主要检测粮堆表层的害虫数量,无法准确地反映粮堆内部害虫的分布情况。随着信息化水平的提升,一些新型的在线监测诱捕技术得到发展并逐渐开始应用于实际生产。但要想做好更准确的监测,必须要明确害虫在粮堆内的分布规律及监测取样数据与虫口密度的相关性。
赤拟谷盗(Tribolium castaneum)易发生于热带和较温暖地区,在我国除东部沿海地区外,还广泛分布于湖北、湖南、河北、河南、宁夏、四川、山西、甘肃、新疆等地[4]。赤拟谷盗是一种典型的粉食性害虫,食性很杂,危害面粉和各类可食用的储藏物,其侵害粮食时还会分泌臭液,使粮食产生臭味和失去食用价值甚至致癌,严重影响粮食的品质;赤拟谷盗一年4~5 代,雄虫寿命500 多天,雌虫寿命200 多天,喜高温,飞行能力较强,喜欢黑暗环境[5-9]。国内外有一些关于赤拟谷盗在粮堆中的行为学和活动规律的研究报道,主要研究了温湿度对赤拟谷盗行为的影响:穆振亚等研究发现赤拟谷盗在20~35 ℃的温度范围内表现明显的趋温性[10];李兆东研究发现赤拟谷盗在30 ℃以下的温度范围内爬行速度与温度正相关[11];杨毅研究发现小麦含水量会显著影响赤拟谷盗在粮堆中的分布情况[12]。但关于赤拟谷盗在粮堆内部如何分布以及如何监测取样的研究很少。
因此,本研究通过新型探管诱捕器和遥感技术,监测小麦堆内部赤拟谷盗的数量和分布情况,研究赤拟谷盗在粮堆内的分布规律和相关因子的关系,为提升储粮害虫监测的精准度提供科学依据。
1 材料与方法
1.1 试验粮食与昆虫
小麦原粮:水分含量为(12.78±0.7)%,容重为(792±3)g/L,杂质率为0.123%,由国家粮食和物资储备局科学研究院储运所提供,采购自江苏省连云港。
赤拟谷盗成虫:四川成都品系,饲养地点为国家粮食和物资储备局科学研究院的试验室(温度为27 ℃,相对湿度为68%),饲养时间为1~2个月。饲料为全麦粉、燕麦片、小麦和酵母按照70∶60∶15∶7 的质量比例混合制得,所用小麦与试验粮种相同。
1.2 仪器与设备
3 t 试验仓:外部高2.6 m,内部高 2.1 m,外径1.4 m,内径1.2 m,可调温,侧面有多个扦样口和观察窗口,国家粮食和物资储备局科学研究院提供(如图1);探管诱捕器:北京邮电大学开发(如图2),该设备可自动检测并记录诱捕的害虫数量,以及对应采集点的空气温湿度[13];熏蒸设备:硫酰氟钢瓶及减压阀,山东省龙口市化工厂提供。
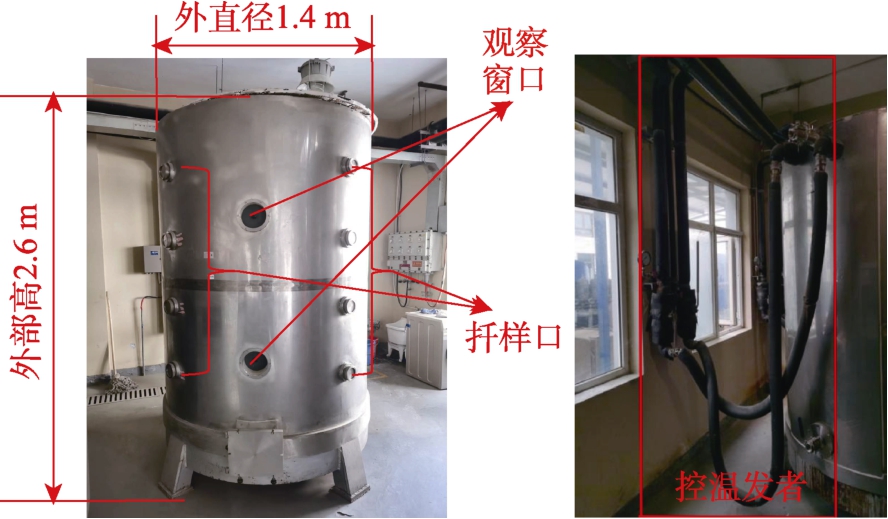
图1 试验仓(左)及控温装置(右)实物图
Fig.1 Physical image of experimental chamber ((left)and temperature control device (right)
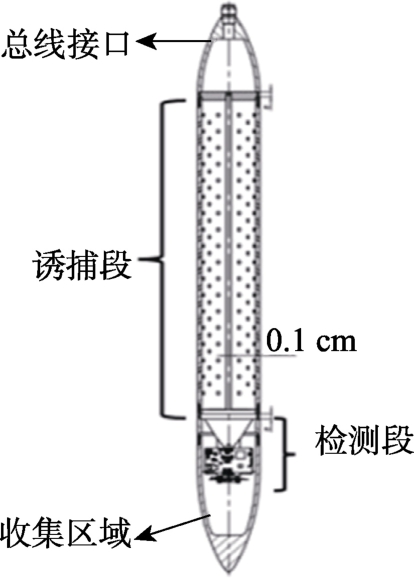
图2 探管诱捕器结构示意图
Fig.2 Schematic diagram of the structure of the probe trap
1.3 试验方法
1.3.1 虫口密度的设置
虫口密度分别设置低、中、高三个梯度,分别为0.1、1.0、3.0 头/kg。试验仓中的小麦为2.25 t,因此投放的相应害虫数量为225、2 250 和6 750 头。
1.3.2 赤拟谷盗的投入和数据采集
仓内粮堆中埋有3×5 个探管,对应粮堆的上、中、下三层以及中部、四周五个方位,探管部署位点及害虫投放点如图3。
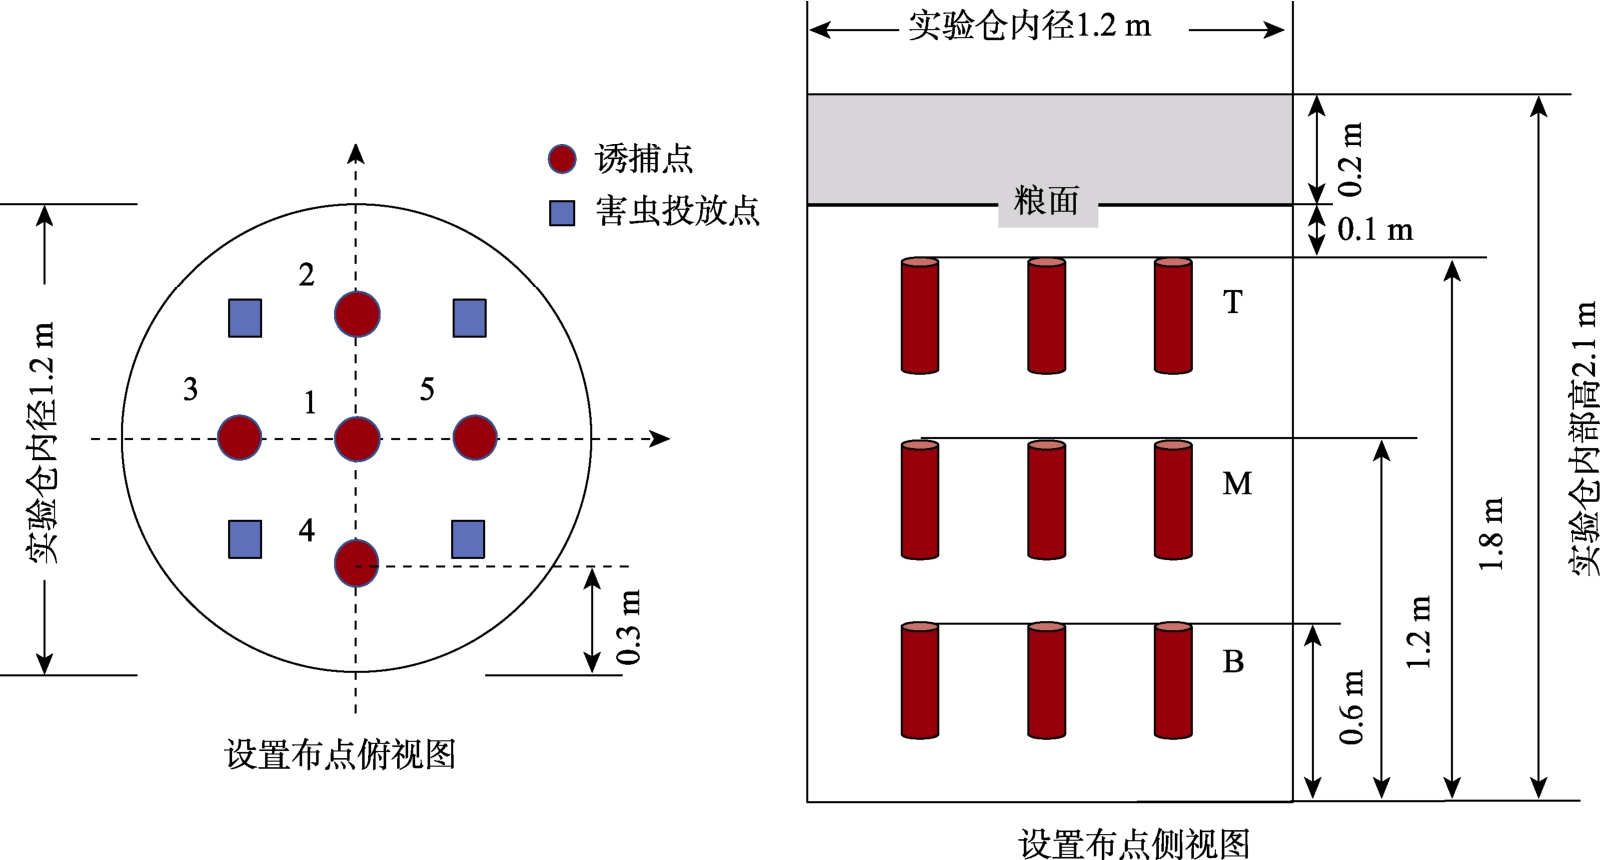
注:红色圆点1~5 代表5 个诱捕点,即探管的部署位置。T 代表顶层,M 代表中层,B 代表底层。
Note: Red dots 1~5 represented the five trap locations, that is, the deployment location of the probe. T stands for top layer, M stands for middle layer, and B stands for bottom layer.
图3 设备部署及害虫投放位置示意图
Fig.3 Schematic diagram of equipment deployment and pest placement location
在试验投放害虫的前一天,人工筛选并挑取出试验所需数量的成虫,将其保存在4 个含有少量小麦的0.5 L 玻璃罐中。将这些玻璃罐放入试验仓内放置24 h,以便害虫适应试验环境。试验开始时将提前一天准备好的装有赤拟谷盗成虫的玻璃罐倾倒在粮堆表面的害虫投放点(如图3 所示),将成虫引入粮堆。
从害虫投放的第二天开始记录电子探管诱捕器采集到的害虫数量和监测点温湿度,每个虫口密度采集连续10 d 数据,重复3 次。试验时间为2022 年9 月—10 月和2023 年2 月—4 月。试验数据中测得的粮堆温度和相对湿度数据为试验仓的粮堆内每日实际数据的平均值,存在一定的自然浮动。试验条件下探管检测到的温度范围为20.50~30.55 ℃,相对湿度范围为32.30%~59.16%。
1.3.3 熏蒸处理
每个虫口密度的数据监测试验结束后对试验仓内粮食进行熏蒸处理,杀死粮堆内的害虫,之后将粮食装袋并低温储藏,更换一批新的粮食进行下一组试验,直至全部试验结束。
1.4 数据分析
1.4.1 分析赤拟谷盗活动与时间的关系
对每个虫口密度3 次重复测得的每日害虫诱捕数总和进行处理计算,计算结果由平均值(mean)±标准误差(Standard error,SE)表示。
根据赤拟谷盗的诱捕数据绘制时间序列图,并通过ADF 检验(Augmented dickey-fuller test)分析诱捕数据的时序性。
定义每个诱捕器在诱捕周期内的诱捕数量平均值为诱捕频率(Trap frequency, Tf),如公式(1)所示:

通过Pearson 相关系数分析诱捕周期长度与诱捕频率的关联性。
1.4.2 分析赤拟谷盗分布与空间的关系
计算每个重复组内不同深度探管的害虫检测百分比(Recovery percentage at different layers,RPDL),分析赤拟谷盗在粮堆内顶层、中层和底层的分布差异。RPDL 的计算公式如公式(2)所示:
其中,L 表示在某一层中5 个探管诱捕器检测到的害虫总数,T 表示该试验仓的所有15 个探管诱捕器检测到的害虫总数。RPDL 的计算结果由平均值±标准误差表示。
计算每个重复组内不同深度探管的害虫检测百分比,从而分析赤拟谷盗在粮堆内上层、中层和下层的分布差异,并通过Pearson 相关系数分析不同诱捕位置的诱捕频率与粮堆虫口密度的相关性。
1.4.3 分析赤拟谷盗分布与温湿度的关系
绘制害虫诱捕数与粮堆温湿度的三维散点图,使用双因素方差分析研究诱捕结果与粮堆温湿度的关系;使用支持向量回归进行粮堆虫口密度评估,并用线性回归分析建立虫口密度的方程。以上数据通过SPSS PRO 和Excel 软件进行分析,时间序列图和散点图通过Origin 软件进行绘制。
2 结果与分析
2.1 赤拟谷盗活动规律时序性分析
根据每天诱捕的赤拟谷盗数量作时序图,如图4 所示。结果表明:在3 种虫口密度下,赤拟谷盗的每日诱捕数无明显的上升或下降趋势。
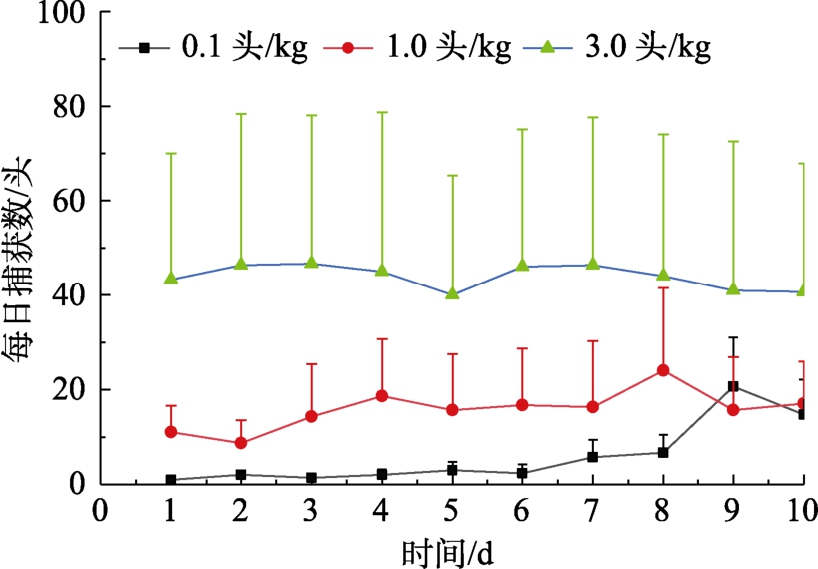
图4 赤拟谷盗在不同虫口密度下每日诱捕数时序图
Fig.4 Time series diagram of daily trapping numbers of Tribolium castaneum under different population densities
对赤拟谷盗3 次重复的诱捕数据取平均值后进行ADF 检验,如表1 所示。结果表明:在3 种虫口密度下,ADF 值均小于10%置信水平的临界值,且不同虫口密度下均有P<0.05,均拒绝原假设,不存在单位根,时间序列平稳。即在3 种虫口密度下,赤拟谷盗诱捕数据的时间序列均平稳,每日诱捕数不随时间发生明显变化。本试验的结果与Jian 等的研究结果类似[14]。
表1 赤拟谷盗ADF 检验结果
Table 1 ADF test results of Tribolium castaneum

注:**、*分别代表P<0.01 和0.05。
Note: * * and * represented P-values <0.01 and 0.05,respectively.
虫口密度/(头/kg) ADF 值P 临界值1% 5% 10%0.1 -9.1160.000** -4.939 -3.478 -2.844 1.0 -4.1370.001** -4.665 -3.367 -2.803 3.0 -2.9480.040* -5.354 -3.646 -2.901
将诱捕周期分别设置为3、5、7 和10 d,计算电子探管诱捕器对赤拟谷盗的诱捕频率与诱捕周期之间的Pearson 相关系数。由表2 可知,赤拟谷盗的诱捕频率与诱捕周期的Pearson 相关系数不随诱捕周期的改变发生明显变化,且Pearson相关系数的P 值均大于0.05,说明赤拟谷盗的诱捕频率与诱捕周期无显著关系。
表2 赤拟谷盗的诱捕频率与诱捕周期之间的Pearson 相关系数
Table 2 Pearson correlation coefficient between the trapping frequency and trapping cycle of Tribolium castaneum

注:图中Pearson 相关系数的P>0.05。
Note: The P-values of Pearson correlation coefficients in the figure were all greater than 0.05.
诱捕周期/d 3 5 7 10 Pearson 相关系数 0.597 0.575 0.569 0.527
2.2 赤拟谷盗空间分布规律研究
由表3 可知,在不同虫口密度下,赤拟谷盗在粮堆内主要分布于顶层和中层。
表3 赤拟谷盗在不同重复组中不同层的RPDL 的统计结果
Table 3 Statistical results of RPDL in different layers of Tribolium castaneum in different repetitive groups

注:表中计算结果为平均值±SE。
Note: The calculation results in the table were the mean ± SE.
虫口密度/(头/kg) 顶层RPDL/% 中层RPDL/% 底层RPDL/%0.1 44.31±12.61 15.05±7.54 40.64±19.90 1.0 46.84±15.24 40.44±19.09 12.72±8.08 3.0 68.52±18.79 18.26±9.99 13.21±9.07
为研究赤拟谷盗诱捕频率与空间位置之间的关系,计算了以10 d 为诱捕周期的赤拟谷盗诱捕频率与电子探管诱捕器部署位置的Pearson 相关系数,如表4 所示。表中Pearson 相关系数的P值均大于等于0.05,说明赤拟谷盗的诱捕频率与诱捕器部署位置之间没有明显关系,即赤拟谷盗在粮堆内的空间分布较为均匀。
表4 赤拟谷盗诱捕频率与不同探管位点之间的Pearson 相关系数
Table 4 Pearson correlation coefficient between the frequency of Tribolium castaneum trapping and different probe sites

注:表中Pearson 相关系数的P≥0.05。
Note: The P-values of Pearson correlation coefficients in the table were all greater than or equal to 0.05.
探管位点中心 四周顶层 0.366 0.382中层 0.571 0.426底层 0.094 0.451粮堆深度
结合表3 和表4,赤拟谷盗在粮堆内主要分布于顶层和中层,且在同一水平方向上均匀分布。此外,当虫口密度较小时,赤拟谷盗在粮堆内主要为聚集分布;当虫口密度较大时,赤拟谷盗在粮堆内均匀分布。本试验的结果与Jian 等的研究结果类似[14]。赤拟谷盗在低虫口密度下聚集分布、高虫口密度下均匀分布的特点,可能是由于低虫口密度时害虫因社会行为而聚集;当虫口密度增大时种群内个体之间的竞争关系变强,开始变为均匀分布。
2.3 赤拟谷盗分布与温湿度关系分析
对赤拟谷盗在不同虫口密度下的每日诱捕数量、日平均粮食温度和日平均相对湿度绘制了三维散点图,观察分析粮食温度和相对湿度这两个环境因素与诱捕数据之间的关系,如图5 所示。

图5 赤拟谷盗在不同虫口密度下的每日诱捕数量与粮堆温度和相对湿度的三维散点图
Fig.5 Three dimensional scatter plot of the daily trapping quantity, grain pile temperature, and relative humidity of the Tribolium castaneum under different population densities
结果表明:在本试验的条件下,赤拟谷盗表现出趋温性和趋湿性;赤拟谷盗适宜活动的温度范围大致为22~30 ℃,相对湿度范围大致为40%~53%。
在不同虫口密度下,为研究赤拟谷盗的诱捕数据与粮堆温度和相对湿度之间是否有显著关系,对电子探管诱捕器测得的粮堆温度和相对湿度数据分组并进行双因素方差分析,如表5 所示。结果表明:当虫口密度较小时,温度对赤拟谷盗诱捕结果的影响并不显著;当虫口密度较大时,温度和相对湿度以及二者的相互作用都对诱捕结果有显著影响,此时赤拟谷盗表现出趋温性和趋湿性。本试验的结果与穆振亚等的研究结果类似[10];李兆东研究发现赤拟谷盗在17 ℃以上开始爬行[15],且该害虫的爬行速度与温度正相关,因此本试验将粮堆温度控制在20 ℃以上符合赤拟谷盗的习性,方便采集到有效的试验数据。此外,由表5 分析可知,当虫口密度较小时,本试验中的赤拟谷盗没有表现出趋温性,而当虫口密度较大时表现出趋温性,可能是因为虫口密度太小时诱捕虫数太少,对分析产生了影响。
表5 基于双因素ANOVA 的赤拟谷盗诱捕数据影响因素分析
Table 5 Analysis of the influencing factors on the trapping data of Tribolium castaneum based on dual factor ANOVA
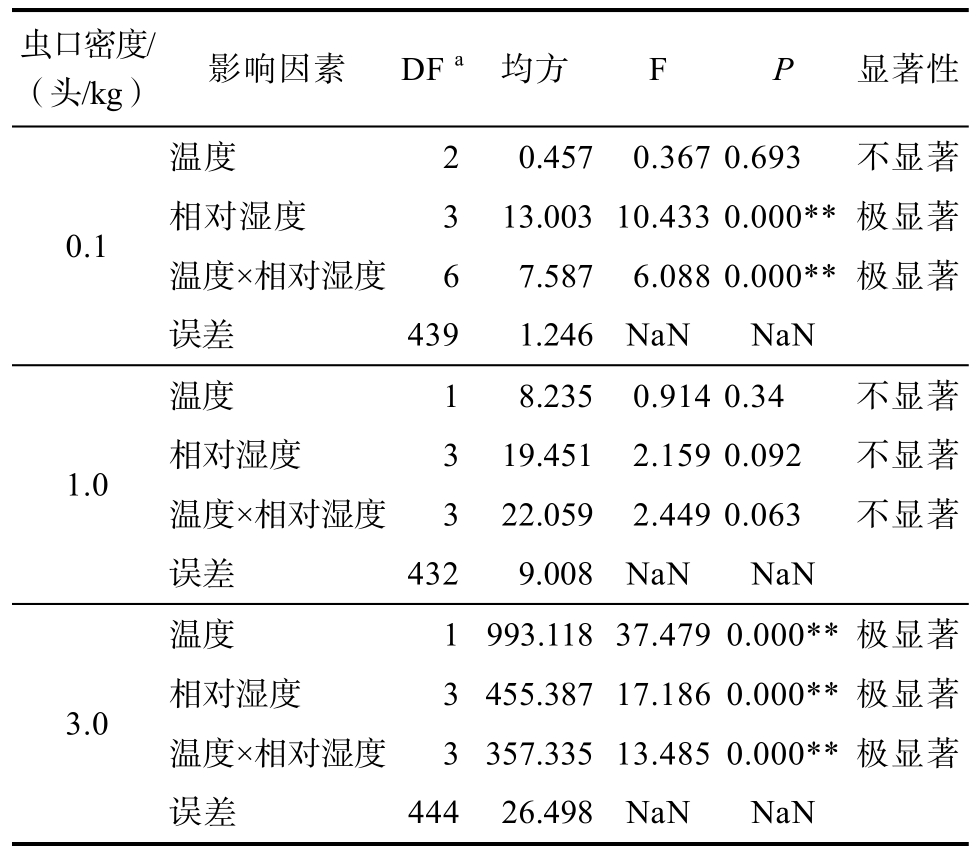
注:a:自由度;**表示P<0.01;NaN 表示计算结果无效。
Note: a: degrees of freedom; ** Indicated that the P-value <0.01;NaN indicated that the calculation result was invalid.
虫口密度/(头/kg)影响因素 DF a 均方 F P 显著性0.1温度 20.457 0.367 0.693 不显著相对湿度 3 13.003 10.433 0.000** 极显著温度×相对湿度67.587 6.088 0.000** 极显著误差 4391.246 NaN NaN 1.0温度 18.235 0.914 0.34 不显著相对湿度 3 19.451 2.159 0.092 不显著温度×相对湿度3 22.059 2.449 0.063 不显著误差 4329.008 NaN NaN 3.0温度 1 993.118 37.479 0.000** 极显著相对湿度 3 455.387 17.186 0.000** 极显著温度×相对湿度3 357.335 13.485 0.000** 极显著误差 444 26.498 NaN NaN
2.4 赤拟谷盗诱捕数量与粮堆虫口密度相关性分析
对赤拟谷盗的探管诱捕数据进行线性回归分析,如表6 所示,其中线性回归分析结果n=405,因变量为虫口密度(头/kg)。在该线性回归分析中,F 检验的P<0.01,呈显著水平,模型基本满足要求;方差膨胀系数(Variance inflation factor,VIF)值全部小于10,模型没有多重共线性问题,说明模型构建良好。此外,温度、相对湿度和捕获数的t 检验P 值均小于0.05,表明这3 个自变量对赤拟谷盗的虫口密度评估均有显著影响,与2.3 以及本试验的结论相近;R2 为0.755,模型拟合度较好,说明该模型可以较准确地评估赤拟谷盗的虫口密度。赤拟谷盗虫口密度评估方程为:
表6 赤拟谷盗诱捕数据的线性回归分析结果表
Table 6 Linear regression analysis results of Tribolium castaneum trapping data

注:*表示P<0.05,**表示P<0.01;a: 非标准化回归系数;b:标准误=B/t 值;c: 常数为0 时的回归系数值;d: 共线性指标;e: 模型拟合指标,代表曲线回归的拟合程度,越接近1 效果越好;f: 调整后的模型拟合指标;g: 通过F 检验,判断是否存在显著的线性关系。
Note: * indicated a P-value <0.05, * * indicated a P-value <0.01; a: Non standardized regression coefficients; b: Standard error=B/t value; c: The regression coefficient value when the constant was 0; d: Collinearity index; e: The model fitting index represents the degree of curve regression fitting, and the closer it was to 1, the better the effect; f: Adjusted model fitting indicators; g: Determine whether there was a significant linear relationship through F-test.
非标准化系数 标准化系数t P VIFd R² e 调整R2f Fg B a 标准误 b Beta c常数 10.566 0.399 / 26.4610.000** /0.755 0.753 F=411.776 P=0.000**温度/℃ -0.321 0.011 -0.801 -29.2690.000** 1.224相对湿度/% -0.017 0.008 -0.057 -2.1450.033* 1.141捕获数/头 0.026 0.005 0.13 5.02 0.000** 1.093
式中,x1 为温度(℃)、x2 为相对湿度(%)、x3 为捕获数(头)。
3 总结
为研究粮堆内赤拟谷盗活动分布规律并完善该害虫在粮堆内的虫口密度评估,本文通过新型害虫探管诱捕器,调查不同虫口密度的赤拟谷盗在3 t 试验仓内小麦粮堆中的活动和分布情况,探究该害虫在粮堆内的分布规律及主要影响因子,并建立相应的虫口密度评估模型,主要研究结果如下:
赤拟谷盗的每日捕获数不随时间发生明显变化。当虫口密度较小时,赤拟谷盗主要在粮堆内的顶层和中层聚集分布,且探管诱捕系统比人工扦样法更容易检测到害虫;当虫口密度较大时,赤拟谷盗在粮堆内均匀分布,探管和人工扦样均能检测到害虫。
赤拟谷盗表现出趋温性和趋湿性,其适宜活动的温度为22~30 ℃,相对湿度为40%~53%。
综合分析害虫时空分布的规律以及温度、湿度的影响,可根据探管透捕器捕获害虫数量对实际虫口密度做出估算,其虫口密度评估方程为:
其中,x1 为温度(℃)、x2 为相对湿度(%)、x3 为捕获数(头)。
[1] 王佩琦, 高兰. 我国粮食产后损失情况概述[J]. 现代食品,2021(6): 1-4.WANG P, GAO L. Overview of postpartum grain loss in China[J]. Modern Food, 2021(6): 1-4.
[2] VICK K W, WEBB J C, WEAVER B A, et al. Sound detection of stored product Insects hat feed inside kernelsofgra1n[J]. Journal of Ecnomic Entomology, 1988, 81(5): 1489-1493.
[3] 高华, 甄彤, 祝玉华. 仓储害虫检测的研究现状及其展望[J].粮食储藏, 2015, 44(6): 10-14.GAO H, ZHEN T, ZHU Y. The current research status and prospects of storage pest detection[J]. Grain Storage, 2015,44(6): 10-14.
[4] 张涛, 伍祎, 柳丽君, 等. 我国赤拟谷盗地理分布研究[J]. 中国粮油学报, 2018, 33(5): 70-75.ZHANG T, WU Y, LIU L, et al. A study on the geographical distribution of red millet thieves in China[J]. Chinese Journal of Cereals and Oils, 2018, 33(5): 70-75.
[5] ASRAR M, ASHRAF N, GOGI M D, et al. Toxicity and repellence of plant oils against Tribolium castaneum, Rhyzopertha dominica and Trogoderma granarium[J]. Pakistan Entomologist,2016, 38(1): 55-63.
[6] THRONE J E, HALLMAN G J, JOHNSON J A, et al.Post-harvest entomology research in the United States department of agriculture-agricultural research service[J]. Pest Management Science, 2003, 59(6-7): 10.
[7] 张育濮, 吕建华, 白春启, 等. 赤拟谷盗的气味经历对其行为反应的影响[J]. 河南工业大学学报(自然科学版), 2018, 39(2):109-112.ZHANG Y, LV J, BAI C, et al. The impact of the odor experience of the red millet thief on its behavioral response[J].Journal of Henan University of Technology (Natural Science Edition), 2018, 39(2): 109-112.
[8] 梁永生. 赤拟谷盗成虫和幼虫对其防御性分泌物主要成分的行为反应[J]. 中国粮油学报, 1995(4): 18-22 .LIANG Y. Behavioral responses of adult and larval red millet beetles to the main components of their defensive secretions[J].Chinese Journal of Cereals and Oils, 1995(4): 18-22.
[9] HOWARD R W, JURENKA R A, BLOMQUIST G J.Prostaglandin synthetase inhibitors in the defensive secretion of the red flour beetle Tribolium castaneum (Herbst) (Coleoptera:Tenebrionidae)[J]. Insect Biochemistry, 1986, 16(5): 75-760.
[10] 穆振亚. 粮堆中常见储粮害虫发生发展规律及预测的研究[D]. 南京: 南京财经大学, 2019.MU Z. Research on the occurrence and development patterns and prediction of common stored grain pests in grain piles[D].Nanjing: Nanjing University of Finance and Economics, 2019.
[11] 李兆东. 温度对储粮害虫运动行为的影响研究[D]. 郑州: 河南工业大学, 2011.LI Z. Study on the effect of temperature on the movement behavior of grain storage pests[D]. Zhengzhou: Henan University of Technology, 2011.
[12] 杨毅. 温湿等引诱因素影响下储粮害虫运动分布研究[D]. 郑州: 河南工业大学, 2015.YANG Y. Research on the distribution of stored grain pests under the influence of temperature and humidity as attractants[D].Zhengzhou: Henan University of Technology, 2015.
[13] QIN G, SU Y W, QIU W H, et al. Design and implementation of an architecture for infrared photoelectric sequence data acquisition with adaptive threshold[C]. 2021 7th IEEE International Conference on Network Intelligence and Digital Content (IC-NIDC).Beijing, 2021: 469-473.
[14] JIAN F, LARSON R, JAYAS D S, et al. Three dimensional temporal and spatial distribution of adults of Tribolium castaneum (Coleoptera: Tenebrionidae) in stored wheat under different temperatures and adult densities[J]. Agricultural Research, 2012, 1(2): 165-174.
[15] 李兆东, 王殿轩, 乔占民.温度对赤拟谷盗爬行和起飞活动的影响[J]. 应用昆虫学报, 2011, 48(5): 1437-1441.LI Z, WANG D, QIAO Z. The effect of temperature on the crawling and takeoff activities of the red millet thief[J]. Journal of Applied Insects, 2011, 48(5): 1437-1441.