为了给小麦收储企业和加工企业提供河北省小麦质量信息,对合理利用当地小麦资源提供技术依据,河北省粮油质量检测中心每年对省内小麦主产区的新收获小麦进行采样监测。本研究收集河北省2010年到2019年十年的新收获小麦质量监测数据,对监测数据从各检测指标的年度变化、各市检测指标平均值比较和各市检测指标优选比较三个方面进行了统计分析。
1 材料与方法
1.1 试验材料
选取2010年至2019年河北省当年新收获小麦作为调查样本,每年6月份到农户进行采样,采样覆盖全省8个小麦主产区,一般每8×8 km设定一个采样区域,采集多个农户的小麦样品混合为一个综合样本,样品为当地的主导品种,品种可以不同。8个小麦主产区分别为:石家庄市、邯郸市、邢台市、衡水市、沧州市、保定市、辛集市和定州市,共计采集2 552个样本。各年度样本个数见表1。
表1 2010—2019年各年度样本数量
Table 1 Numbers of samples in each year from 2010 to 2019 个

?年度 2010 2011 2012 2013 2014 2015 2016 2017 2018 2019总计样本 317 245 245 245 245 245 245 269 251 245 2 552
1.2 试验方法
所有样品依据国家标准 GB 1351—2008《小麦》[1]和相关规定进行样品制备。
容重:参照GB/T 5498《粮油检验 容重测定》[2];
千粒重:参照 GB/T 5519 《谷物与豆类 千粒重的测定》[3];
不完善粒、生芽粒:参照 GB/T 5494—2008《粮油检验 粮食、油料的杂质、不完善粒检验》[4];
水分:参照GB/T 24898—2010《粮油检验 小麦水分含量测定 近红外法》[5];
硬度指数:参照GB/T 21304—2007《小麦硬度测定 硬度指数法》[6];
降落数值:参照GB/T 10361—2008《小麦、黑麦及其面粉,杜伦麦及其粗粒粉 降落数值的测定Hagberg-Perten法》[7];
湿面筋:参照GB/T 5506.2—2008《小麦和小麦粉面筋含量第2部分:仪器法测定湿面筋》[8];
蛋白质:参照GB/T 24899—2010《粮油检验小麦粗蛋白质含量测定 近红外法》[9]。
1.3 数据处理
采用Microsoft Excel 2016进行数据分析,结果表示为平均值±标准差。
2 结果与分析
2.1 河北省2010年至2019年小麦品质指标年度变化
2.1.1 容重
容重是粮食籽粒在单位容积内的质量,是小麦定等的依据。2010年至 2019年的平均容重为784 g/L,2013年、2018年的平均容重较低,为非正常年景,2014年、2015年、2016年、2019年平均容重较高,2016年的平均容重最高,达到了797 g/L。十年中最高的容重为840 g/L(2019年产自辛集,品种为藁优2018),见表2。
表2 2010—2019年容重变化表
Table 2 Change table of test weight from 2010 to 2019 g/L

年度 2010 2011 2012 2013 2014 2015 2016 2017 2018 2019总计平均值 780 786 789 761 792 791 797 788 768 795 784标准差 20 17 18 22 20 21 21 19 20 18 23
从各等级样品占样本个数百分比的情况来看,三等以上(含三等,下同)总占比为92.7%,一等以上总占比为46.9%。除2013年和2018年两个非正常年景外,其它年度三等以上占比均在94%以上,2019年最高,占比达到了 98.8%;一等以上占比均在37%以上,2019年最高,占比达到了72.2%,见表3。
表3 2010—2019年不同等级占比变化表
Table 3 Change of the percentage of different grades from 2010 to 2019 %

年度 2010 2011 2012 2013 2014 2015 2016 2017 2018 2019总体三等以上 95.3 97.6 98.0 69.8 94.3 97.1 95.9 96.7 82.5 98.8 92.7一等以上 37.5 44.5 55.9 7.8 60.0 61.2 70.6 49.1 15.1 72.2 46.9
2.1.2 千粒重
千粒重采用自然水分千粒重,是含自然水分的颗粒籽粒的质量,用g来表示,是体现籽粒大小与饱满程度的一项指标,也是田间预测产量时的重要依据之一。2012—2019年的平均千粒重为39.6 g,除2013年和2018年两个非正常年景外,其它年度的平均千粒重都在 37.6~42.8 g,2016年平均千粒重达到了 42.8 g。所有样本中最高的千粒重为52.8 g(2016年产自沧州),见表4。
表4 2010—2019年千粒重年度变化表
Table 4 Change of the 1 000-kernel-weight from 2010 to 2019 g

注:“/”表示该年度数据不完整,未参与统计,下同。
年度 2010 2011 2012 2013 2014 2015 2016 2017 2018 2019总体平均值 / / 37.6 35.2 42.3 39.4 42.8 41.0 36.7 41.6 39.6标准差 / / 3.2 3.1 3.4 2.6 2.7 2.8 3.3 3.6 4.0
2.1.3 不完善粒
不完善粒是受到损伤但尚有使用价值的小麦颗粒,包括虫蚀粒、病斑粒、破损粒、生芽粒和生霉粒,不完善粒含量是小麦质量检验中的重要指标,该指标对小麦的加工品质也有重大影响。2010—2019年的平均不完善粒含量为3.5%,2010年、2013年、2016年平均不完善粒含量相对较高(大于4.0%),尤其2013年受芽麦的影响平均不完善粒含量最高(4.6%),其它年度的平均不完善粒含量都较低(小于4.0%),见表5。
表5 2010—2019年不完善粒含量年度变化表
Table 5 Change of unsound kernel content from 2010 to 2019 %

年度 2010 2011 2012 2013 2014 2015 2016 2017 2018 2019总体平均值 4.1 2.3 2.7 4.6 3.3 2.8 4.1 3.9 3.6 3.3 3.5标准差 3.5 1.3 1.3 4.4 2.0 1.4 3.8 1.8 1.6 1.7 2.6
从不完善粒含量在 6%以下、8%以下的样本占样本个数百分比的情况来看,6%以上样本总体占比为91.3%,8%以下总体占比为96.1%。除2010年、2013年、2016年较低外,其它年度6%以下占比均在90%以上;8%以下占比均在97%以上,2015年最高,占比达到了100%,见表6。
表6 2010—2019年不完善粒含量占比年度变化表
Table 6 Change of the percentage of unsound kernel content from 2010 to 2019 %

年度 2010 2011 2012 2013 2014 2015 2016 2017 2018 2019总体6%以下 88.6 98.8 96.7 77.6 93.9 95.9 84.9 90.0 93.2 94.3 91.3 8%以下 93.1 99.6 99.6 88.2 98.4 100.0 91.8 97.0 97.6 98.0 96.1
2.1.4 生芽粒
生芽粒是不完善粒中的一种,生芽粒含量对小麦品质的影响很大。2011—2019年的平均生芽粒含量为0.7%,2013年、2016年平均生芽粒含量相对较高(大于1.0%),均为收获季节遭受阴雨天气所致,尤其2013年平均生芽粒含量最高(2.2%),当年生芽粒含量最高达到了 28.5%,其它年度的平均生芽粒含量都较低(小于1.0%),见表7。
表7 2010—2019年生芽粒含量占比年度变化表
Table 7 Change of the percentage of sprouted kernel content from 2010 to 2019 %

年度 2010 2011 2012 2013 2014 2015 2016 2017 2018 2019总体平均值 / 0.1 0.1 2.2 0.6 0.2 1.4 0.8 0.7 0.3 0.7标准差 / 0.4 0.3 4.0 1.1 0.3 3.3 0.9 0.9 0.4 1.9
2.1.5 降落数值
降落数值是反映α-淀粉酶活性的指标,将小麦粉加水加热糊化,糊化物在α-淀粉酶作用下液化,以搅拌器通过该糊化物特定距离的时间为降落数值,以 s(秒)计,当生芽粒达到一定含量时降落数值下降明显[10]。2012—2019年的平均降落数值为337s,2013年度河北省所有产区的小麦普遍发芽严重,降落数值明显降低,平均降落数值为260 s,当年降落数值最低低至103 s,见表8。
表8 2010—2019年降落数值年度变化表
Table 8 Change of falling number from 2010 to 2019 s

年度 2010 2011 2012 2013 2014 2015 2016 2017 2018 2019总体平均值 / / 353 260images/BZ_111_1706_3134_1783_3193.png366 340 390 298 340 337标准差 / / 40 56images/BZ_111_1706_3193_1783_3252.png35 51 27 32 19 57
2.1.6 水分含量年度变化
水分含量是小麦籽粒的含水量,用百分含量表示,是粮食储存过程中控制的一项重要指标。2010—2019年的平均水分含量为11.3%,2013年平均水分达到了12.1%,2013年水分最高含量达到了15.0%,见表9。
表9 2010—2019年水分含量年度变化表
Table 9 Change of moisture content from 2010 to 2019 %

年度 2010 2011 2012 2013 2014 2015 2016 2017 2018 2019总体平均值 11.3 12.1 11.2 12.1 11.5 10.9 11.4 10.9 10.4 11.0 11.3标准差 0.8 0.5 0.7 0.9 0.7 0.7 0.6 0.6 0.7 0.5 0.8
2.1.7 硬度指数
硬度指数是反映小麦硬度的一项指标,是在规定条件下粉碎小麦样品,用留存在筛网上的样品占试样的质量分数来表示,硬度指数越大,小麦的硬度越高。2010—2019年的平均硬度指数为65.8。从统计的数据看,硬度指数的年度变化并不明显,见表10。
表10 2010—2019年硬度指数年度变化表
Table 10 Change of hardness index from 2010 to 2019

年度 2010 2011 2012 2013 2014 2015 2016 2017 2018 2019总体平均值 65 66 65 67 67 66 65 67 65 66 65.8标准差 4 3 2 3 2 3 3 3 3 2 3
2.1.8 湿面筋含量年度变化
湿面筋是主要由小麦中的谷蛋白和醇溶蛋白经水合而成、未经脱水干燥的具有粘弹性的物质。对小麦品质的影响很大。本文中的湿面筋是换算为14%水分的湿面筋含量。2012—2019年的平均湿面筋含量为 24.0%~33.4%,2017年平均湿面筋最高,达到了 33.4%,近年来湿面筋含量有增长的趋势,最高湿面筋含量为40.2%(2017年产自邢台市,品种为石麦21),见表11。
表11 2010—2019年湿面筋含量年度变化表
Table 11 Change of gluten content from 2010 to 2019 %

年度 2010 2011 2012 2013 2014 2015 2016 2017 2018 2019总体平均值 / / 24.3 27.2 25.3 24.4 24.0 33.4 28.9 30.7 27.3标准差 / / 2.3 2.2 1.9 2.2 2.4 1.5 1.9 1.8 3.9
2.1.9 蛋白质含量
蛋白质含量是小麦中主要的营养成分指标,对小麦品质的影响很大。本文中的蛋白质含量以干基计。2012—2019年的平均蛋白质含量为12.8%~14.4%,总体平均蛋白质含量为 13.6%。2018年平均蛋白质含量最高,达到了14.4%,最高蛋白质含量为16.8%(2018年产自衡水市,品种为师栾02-1),见表12。
表12 2010—2019年蛋白质含量年度变化表
Table 12 Change of protein content from 2010 to 2019 %

年度 2010 2011 2012 2013 2014 2015 2016 2017 2018 2019总体平均值 / / 13.5 14.1 13.1 13.0 12.8 13.8 14.4 14.2 13.6标准差 / / 0.6 0.7 0.6 0.6 0.7 0.6 0.7 0.7 0.9
2.2 河北省2010年至2019年小麦质量监测数据各市检测指标平均值比较
通过对河北省2010年至2019年小麦质量监测数据进行分市统计,对各市不同检测指标的平均值进行了比较,并按照优劣进行了排序。各市的样本个数见表13。
表13 各市样本个数表
Table 13 Number of samples in each city 个

市 石家庄 邯郸 邢台 衡水 沧州 保定 辛集 定州 全省样本个数 456 435 362 398 432 341 63 65 2552
2.2.1 各市小麦容重平均值比较
辛集市、邯郸市、邢台市十年来小麦的平均容重为国家标准一等,石家庄市、衡水市、保定市、定州市为国家标准二等,沧州市为国家标准三等,见表14。
表14 各市容重平均值比较
Table 14 Comparison of average test weight in each city g/L

images/BZ_112_1285_2216_1407_2272.pngimages/BZ_112_1407_2216_1496_2272.pngimages/BZ_112_1496_2216_1585_2272.pngimages/BZ_112_1585_2216_1674_2272.pngimages/BZ_112_1674_2216_1798_2272.pngimages/BZ_112_1798_2216_1886_2272.pngimages/BZ_112_1887_2216_1975_2272.pngimages/BZ_112_1975_2216_2064_2272.pngimages/BZ_112_2064_2216_2152_2272.pngimages/BZ_112_2152_2216_2241_2272.pngimages/BZ_112_1285_2274_1407_2330.pngimages/BZ_112_1407_2274_1496_2330.pngimages/BZ_112_1496_2274_1585_2330.pngimages/BZ_112_1585_2274_1674_2330.pngimages/BZ_112_1674_2274_1798_2330.pngimages/BZ_112_1798_2274_1886_2330.pngimages/BZ_112_1887_2274_1975_2330.pngimages/BZ_112_1975_2274_2064_2330.pngimages/BZ_112_2064_2274_2152_2330.pngimages/BZ_112_2152_2274_2241_2330.pngimages/BZ_112_1285_2330_1407_2387.pngimages/BZ_112_1407_2330_1496_2387.pngimages/BZ_112_1496_2330_1585_2387.pngimages/BZ_112_1585_2330_1674_2387.pngimages/BZ_112_1674_2330_1798_2387.pngimages/BZ_112_1798_2330_1886_2387.pngimages/BZ_112_1887_2330_1975_2387.pngimages/BZ_112_1975_2330_2064_2387.pngimages/BZ_112_2064_2330_2152_2387.pngimages/BZ_112_2152_2330_2241_2387.png
2.2.2 各市小麦千粒重平均值比较
邯郸市、邢台市、保定市、衡水市小麦的平均千粒重在31.0 g以上,沧州市、辛集市、石家庄市在30.0~31.0 g,定州市低于30.0 g,见表15。
表15 各市小麦千粒重平均值比较
Table 15 Comparison of average mass of 1 000 grains in each city g

images/BZ_112_1285_2909_1403_2968.pngimages/BZ_112_1403_2909_1494_2968.pngimages/BZ_112_1494_2909_1585_2968.pngimages/BZ_112_1585_2909_1675_2968.pngimages/BZ_112_1675_2909_1766_2968.pngimages/BZ_112_1766_2909_1857_2968.pngimages/BZ_112_1857_2909_1948_2968.pngimages/BZ_112_1948_2909_2067_2968.pngimages/BZ_112_2067_2909_2154_2968.pngimages/BZ_112_2154_2909_2241_2968.pngimages/BZ_112_1285_2970_1403_3030.pngimages/BZ_112_1403_2970_1494_3030.pngimages/BZ_112_1494_2970_1585_3030.pngimages/BZ_112_1585_2970_1675_3030.pngimages/BZ_112_1675_2970_1766_3030.pngimages/BZ_112_1766_2970_1857_3030.pngimages/BZ_112_1857_2970_1948_3030.pngimages/BZ_112_1948_2970_2067_3030.pngimages/BZ_112_2067_2970_2154_3030.pngimages/BZ_112_2154_2970_2241_3030.pngimages/BZ_112_1285_3030_1403_3089.pngimages/BZ_112_1403_3030_1494_3089.pngimages/BZ_112_1494_3030_1585_3089.pngimages/BZ_112_1585_3030_1675_3089.pngimages/BZ_112_1675_3030_1766_3089.pngimages/BZ_112_1766_3030_1857_3089.pngimages/BZ_112_1857_3030_1948_3089.pngimages/BZ_112_1948_3030_2067_3089.pngimages/BZ_112_2067_3030_2154_3089.pngimages/BZ_112_2154_3030_2241_3089.png
2.2.3 各市小麦不完善粒含量平均值比较
辛集市、定州市小麦的平均不完善粒含量低于 3.0%,保定市、衡水市、石家庄市、邢台市、沧州市在3.0%~4.0%,邯郸市高于4.0%,见表16。
表16 各市小麦不完善粒含量平均值比较
Table 16 Comparison of average unsound kernel content in each city %

市 辛集 定州 保定 衡水 石家庄 邢台 沧州 邯郸 全省平均值images/BZ_113_347_653_438_713.pngimages/BZ_113_438_653_529_713.pngimages/BZ_113_529_653_620_713.pngimages/BZ_113_620_653_711_713.pngimages/BZ_113_711_653_831_713.pngimages/BZ_113_831_653_922_713.pngimages/BZ_113_922_653_1012_713.pngimages/BZ_113_1012_653_1103_713.pngimages/BZ_113_1103_653_1193_713.png标准差images/BZ_113_347_713_438_773.pngimages/BZ_113_438_713_529_773.pngimages/BZ_113_529_713_620_773.pngimages/BZ_113_620_713_711_773.pngimages/BZ_113_711_713_831_773.pngimages/BZ_113_831_713_922_773.pngimages/BZ_113_922_713_1012_773.pngimages/BZ_113_1012_713_1103_773.pngimages/BZ_113_1103_713_1193_773.png
2.2.4 各市小麦生芽粒含量平均值比较
辛集市、定州市、石家庄市、沧州市、保定市小麦的平均生芽粒含量在0.5%以内,邢台市、衡水市在0.6%~0.7%,邯郸市高于1.0%,见表17。
表17 各市小麦生芽粒含量平均值比较
Table 17 Comparison of average sprouted kernel content in each city %

市images/BZ_113_355_1273_441_1332.pngimages/BZ_113_441_1273_527_1332.pngimages/BZ_113_527_1273_651_1332.pngimages/BZ_113_651_1273_741_1332.pngimages/BZ_113_741_1273_832_1332.pngimages/BZ_113_832_1273_922_1332.pngimages/BZ_113_922_1273_1012_1332.pngimages/BZ_113_1012_1273_1103_1332.png全省平均值images/BZ_113_355_1334_441_1393.pngimages/BZ_113_441_1334_527_1393.pngimages/BZ_113_527_1334_651_1393.pngimages/BZ_113_651_1334_741_1393.pngimages/BZ_113_741_1334_832_1393.pngimages/BZ_113_832_1334_922_1393.pngimages/BZ_113_922_1334_1012_1393.pngimages/BZ_113_1012_1334_1103_1393.png0.7标准差images/BZ_113_355_1393_441_1452.pngimages/BZ_113_441_1393_527_1452.pngimages/BZ_113_527_1393_651_1452.pngimages/BZ_113_651_1393_741_1452.pngimages/BZ_113_741_1393_832_1452.pngimages/BZ_113_832_1393_922_1452.pngimages/BZ_113_922_1393_1012_1452.pngimages/BZ_113_1012_1393_1103_1452.png1.9
2.2.5 各市小麦降落数值含量平均值比较
辛集市、定州市、保定市小麦的平均降落数值在 340 s以上,沧州市、石家庄市、邢台市、衡水市在320~335 s,邯郸市低于320 s,见表18。
表18 各市小麦降落数值含量平均值比较
Table 18 Comparison of average falling number in each city s

市 辛集 定州 保定 沧州 石家庄 邢台 衡水 邯郸 全省平均值images/BZ_113_357_1969_448_2028.pngimages/BZ_113_448_1969_538_2028.pngimages/BZ_113_538_1969_628_2028.pngimages/BZ_113_628_1969_719_2028.pngimages/BZ_113_719_1969_833_2028.pngimages/BZ_113_833_1969_923_2028.pngimages/BZ_113_923_1969_1013_2028.pngimages/BZ_113_1013_1969_1103_2028.pngimages/BZ_113_1103_1969_1193_2028.png标准差images/BZ_113_357_2028_448_2087.pngimages/BZ_113_448_2028_538_2087.pngimages/BZ_113_538_2028_628_2087.pngimages/BZ_113_628_2028_719_2087.pngimages/BZ_113_719_2028_833_2087.pngimages/BZ_113_833_2028_923_2087.pngimages/BZ_113_923_2028_1013_2087.pngimages/BZ_113_1013_2028_1103_2087.pngimages/BZ_113_1103_2028_1193_2087.png
2.2.6 各市小麦水分含量平均值比较
各市小麦的平均水分含量在11.0%~11.6%,差异不大,见表19。
表19 各市小麦水分含量平均值比较
Table 19 Comparison of average moisture content in each city %

images/BZ_113_236_2514_350_2573.pngimages/BZ_113_350_2514_460_2573.pngimages/BZ_113_460_2514_552_2573.pngimages/BZ_113_552_2514_643_2573.pngimages/BZ_113_643_2514_735_2573.pngimages/BZ_113_735_2514_827_2573.pngimages/BZ_113_827_2514_918_2573.pngimages/BZ_113_918_2514_1010_2573.pngimages/BZ_113_1010_2514_1101_2573.pngimages/BZ_113_1101_2514_1193_2573.pngimages/BZ_113_236_2575_350_2635.pngimages/BZ_113_350_2575_460_2635.pngimages/BZ_113_460_2575_552_2635.pngimages/BZ_113_552_2575_643_2635.pngimages/BZ_113_643_2575_735_2635.pngimages/BZ_113_735_2575_827_2635.pngimages/BZ_113_827_2575_918_2635.pngimages/BZ_113_918_2575_1010_2635.pngimages/BZ_113_1010_2575_1101_2635.pngimages/BZ_113_1101_2575_1193_2635.pngimages/BZ_113_236_2635_350_2694.pngimages/BZ_113_350_2635_460_2694.pngimages/BZ_113_460_2635_552_2694.pngimages/BZ_113_552_2635_643_2694.pngimages/BZ_113_643_2635_735_2694.pngimages/BZ_113_735_2635_827_2694.pngimages/BZ_113_827_2635_918_2694.pngimages/BZ_113_918_2635_1010_2694.pngimages/BZ_113_1010_2635_1101_2694.pngimages/BZ_113_1101_2635_1193_2694.png
2.2.7 各市小麦硬度指数平均值比较
各市小麦的平均硬度指数在65~67,差异不大,见表20。
表20 各市小麦硬度指数平均值比较
Table 20 Comparison of average hardness index in each city

images/BZ_113_236_3071_347_3130.pngimages/BZ_113_347_3071_431_3130.pngimages/BZ_113_431_3071_547_3130.pngimages/BZ_113_547_3071_639_3130.pngimages/BZ_113_639_3071_732_3130.pngimages/BZ_113_732_3071_824_3130.pngimages/BZ_113_824_3071_916_3130.pngimages/BZ_113_916_3071_1008_3130.pngimages/BZ_113_1008_3071_1101_3130.pngimages/BZ_113_1101_3071_1193_3130.pngimages/BZ_113_236_3132_347_3192.pngimages/BZ_113_347_3132_431_3192.pngimages/BZ_113_431_3132_547_3192.pngimages/BZ_113_547_3132_639_3192.pngimages/BZ_113_639_3132_732_3192.pngimages/BZ_113_732_3132_824_3192.pngimages/BZ_113_824_3132_916_3192.pngimages/BZ_113_916_3132_1008_3192.pngimages/BZ_113_1008_3132_1101_3192.pngimages/BZ_113_1101_3132_1193_3192.pngimages/BZ_113_236_3192_347_3251.pngimages/BZ_113_347_3192_431_3251.pngimages/BZ_113_431_3192_547_3251.pngimages/BZ_113_547_3192_639_3251.pngimages/BZ_113_639_3192_732_3251.pngimages/BZ_113_732_3192_824_3251.pngimages/BZ_113_824_3192_916_3251.pngimages/BZ_113_916_3192_1008_3251.pngimages/BZ_113_1008_3192_1101_3251.pngimages/BZ_113_1101_3192_1193_3251.png
2.2.8 各市小麦湿面筋含量平均值比较
各市小麦的十年平均湿面筋含量在 26.7%~27.8%之间,差异不大,见表21。
表21 各市小麦湿面筋含量平均值比较
Table 21 Comparison of average gluten content in each city %

市 保定 石家庄 衡水 沧州 辛集 邢台 定州 邯郸 全省平均值 27.8 27.6 27.5 27.5 27.5 27.0 27.0 26.7 27.3标准差 3.8 3.9 3.5 3.7 3.5 4.4 3.8 3.7 3.9
2.2.9 各市小麦蛋白质含量平均值比较
各市小麦的十年平均蛋白质含量在 13.5%~13.8%之间,差异不大,见表22。
表22 各市小麦蛋白质含量平均值比较
Table 22 Comparison of average protein content in each city %

images/BZ_113_1285_1286_1402_1346.pngimages/BZ_113_1402_1286_1481_1346.pngimages/BZ_113_1481_1286_1593_1346.pngimages/BZ_113_1593_1286_1686_1346.pngimages/BZ_113_1685_1286_1778_1346.pngimages/BZ_113_1778_1286_1871_1346.pngimages/BZ_113_1871_1286_1964_1346.pngimages/BZ_113_1963_1286_2056_1346.pngimages/BZ_113_2056_1286_2149_1346.pngimages/BZ_113_2149_1286_2241_1346.pngimages/BZ_113_1285_1348_1402_1407.pngimages/BZ_113_1402_1348_1481_1407.pngimages/BZ_113_1481_1348_1593_1407.pngimages/BZ_113_1593_1348_1686_1407.pngimages/BZ_113_1685_1348_1778_1407.pngimages/BZ_113_1778_1348_1871_1407.pngimages/BZ_113_1871_1348_1964_1407.pngimages/BZ_113_1963_1348_2056_1407.pngimages/BZ_113_2056_1348_2149_1407.pngimages/BZ_113_2149_1348_2241_1407.pngimages/BZ_113_1285_1407_1402_1467.pngimages/BZ_113_1402_1407_1481_1467.pngimages/BZ_113_1481_1407_1593_1467.pngimages/BZ_113_1593_1407_1686_1467.pngimages/BZ_113_1685_1407_1778_1467.pngimages/BZ_113_1778_1407_1871_1467.pngimages/BZ_113_1871_1407_1964_1467.pngimages/BZ_113_1963_1407_2056_1467.pngimages/BZ_113_2056_1407_2149_1467.pngimages/BZ_113_2149_1407_2241_1467.png
2.3 河北省2010年至2019年小麦质量监测数据各市检测指标优选比较
通过对各主产市2010年至2019年小麦质量监测数据进行进一步优选,设定检测指标的优选值,对高于设定优选值的样品占本市样本百分比进行统计比较。
2.3.1 各市高容重样品占本市样本百分比比较
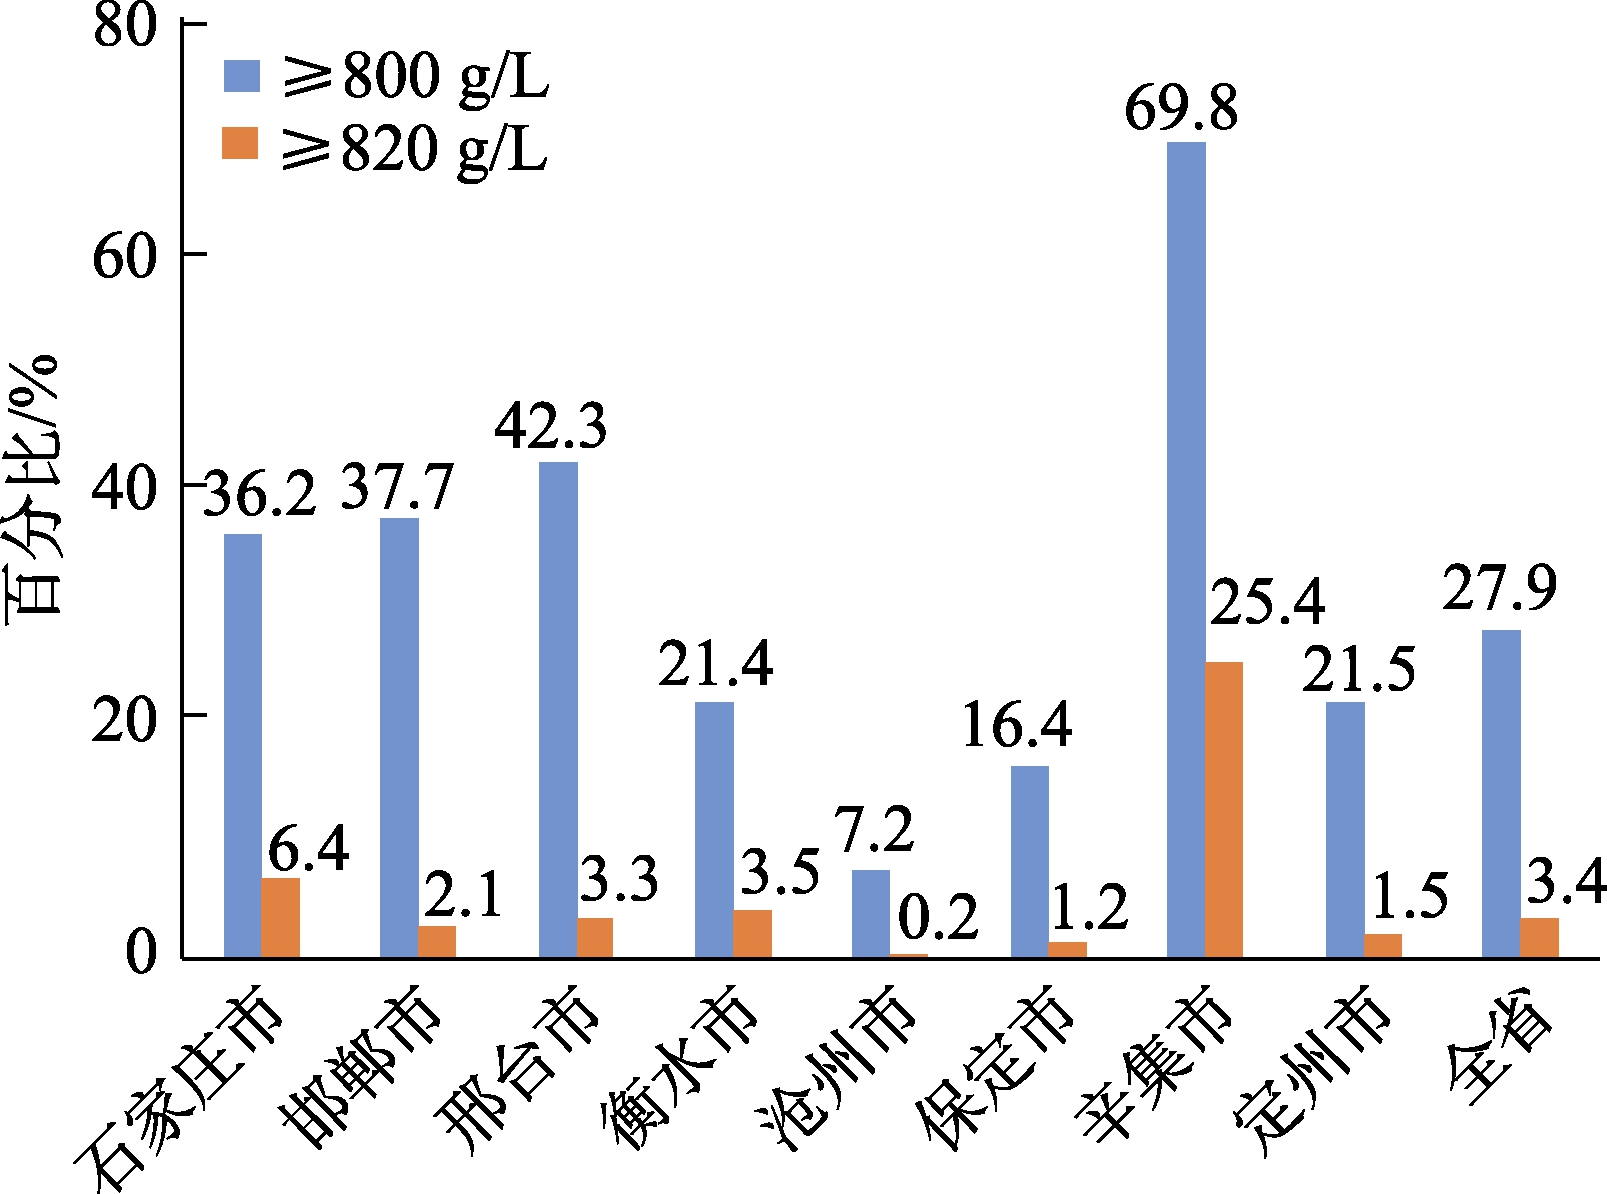
容重在800 g/L以上的小麦,辛集市、邢台市明显占比较高,沧州占比最低。容重在 820 g/L以上的小麦,辛集市、石家庄市明显占比较高,沧州占比最低。辛集市在高容重小麦中具有明显比较优势,如图1。

图1 高容重占本市样本百分比比较
Fig.1 Percentage comparison of high-test weight samples in this city
2.3.2 各市高千粒重样品占本市样本百分比比较
千粒重无论是在44.0 g以上的还是在46.0 g以上的小麦,邯郸市、辛集市明显占比较高,保定市、定州市则占比较低。邯郸市、辛集市在高千粒重小麦中具有明显比较优势,如图2。

图2 高千粒重占本市样本百分比比较
Fig.2 Percentage comparison of samples with high 1 000-kernel-weight in this city
2.3.3 各市低不完善粒含量样品占本市样本百分比比较
不完善粒含量在4.0%以内的小麦,辛集市、衡水市、保定市占比在80%以上,邯郸市占比低于60%,不完善粒含量在2.0%以内的小麦,辛集市、定州市占比在 40%以上,邯郸市占比低于15%。辛集市在低不完善粒含量中具有明显比较优势,如图3。

图3 低不完善粒含量占本市样本百分比比较
Fig.3 Percentage comparison of samples with low-unsound kernel content in this city
2.3.4 各市高硬度指数样品占本市样本百分比比较
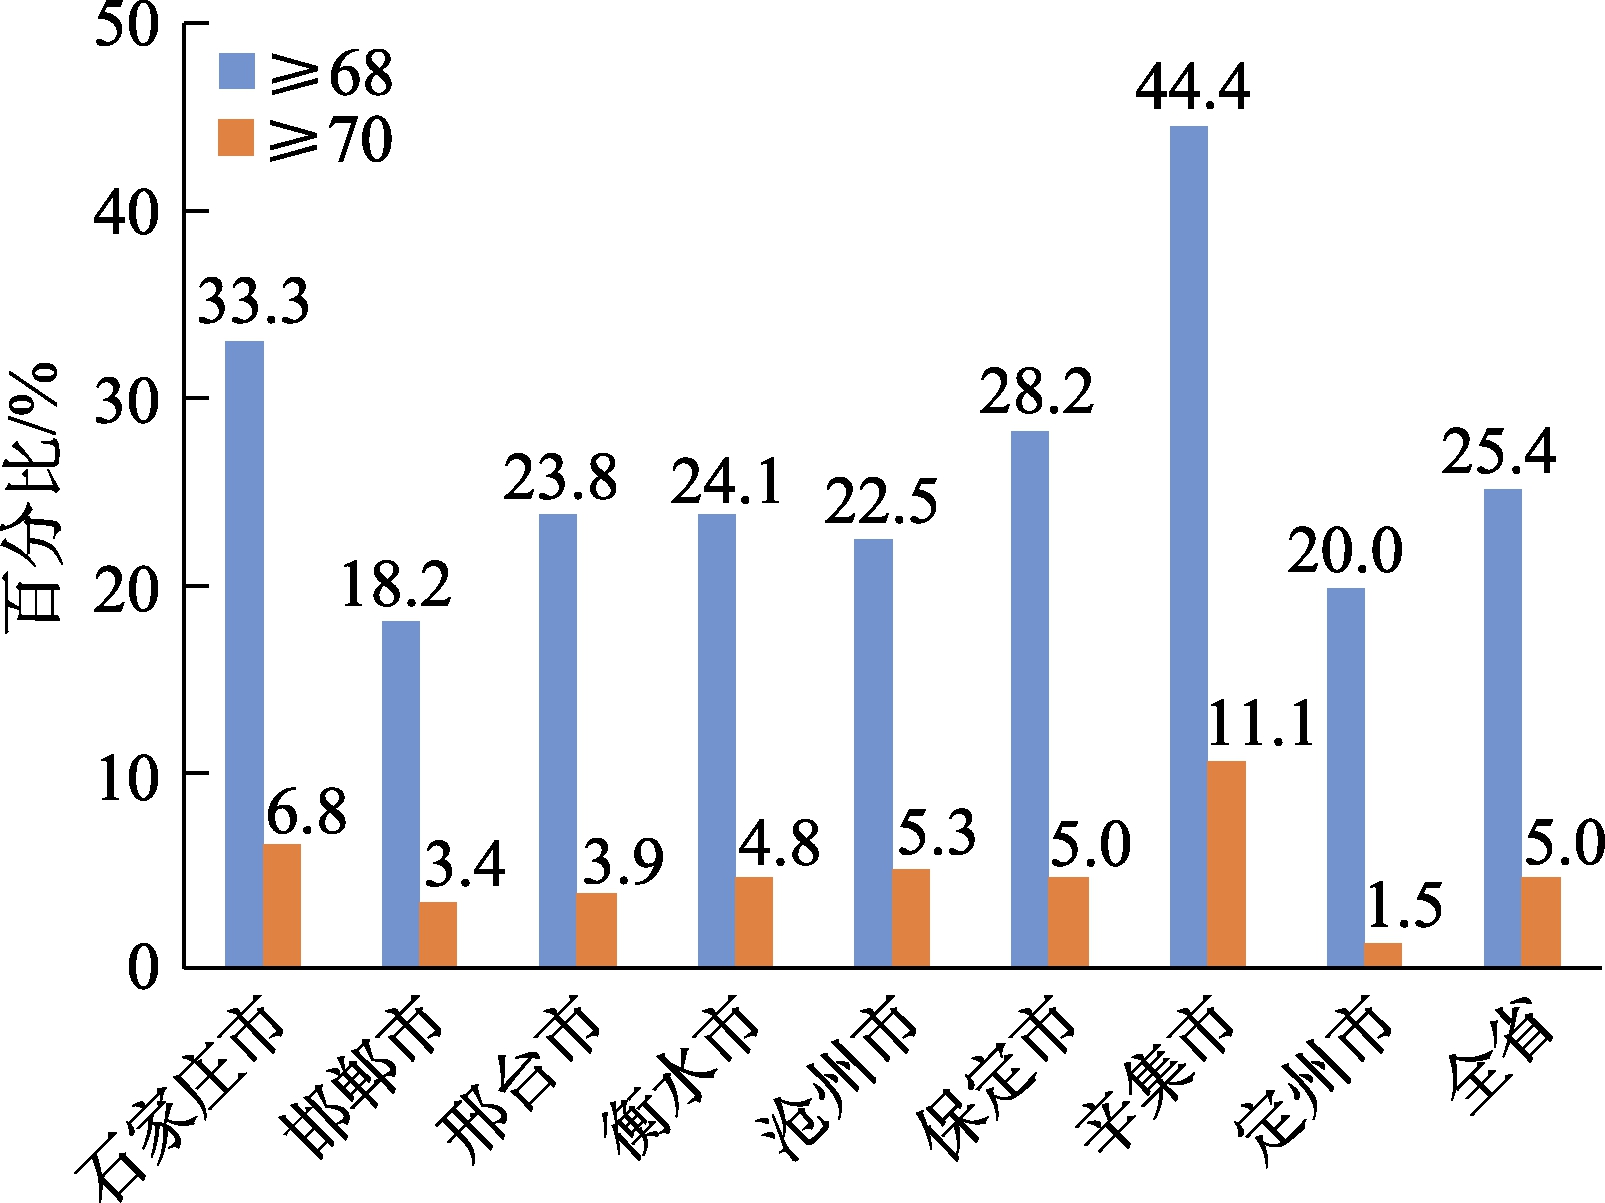
硬度指数在68以上的小麦,辛集市、石家庄市占比在30%以上,邯郸市占比低于20%。硬度指数在70以上的小麦,辛集市、石家庄市占比在6%以上,邯郸市、定州市占比低于 3.5%。辛集市和石家庄市在高硬度指数上有明显比较优势,如图4。

图4 高硬度指数占本市样本百分比比较
Fig.4 Percentage comparison of samples with high-harness index in this city
2.3.5 各市高湿面筋含量样品占本市样本百分比比较
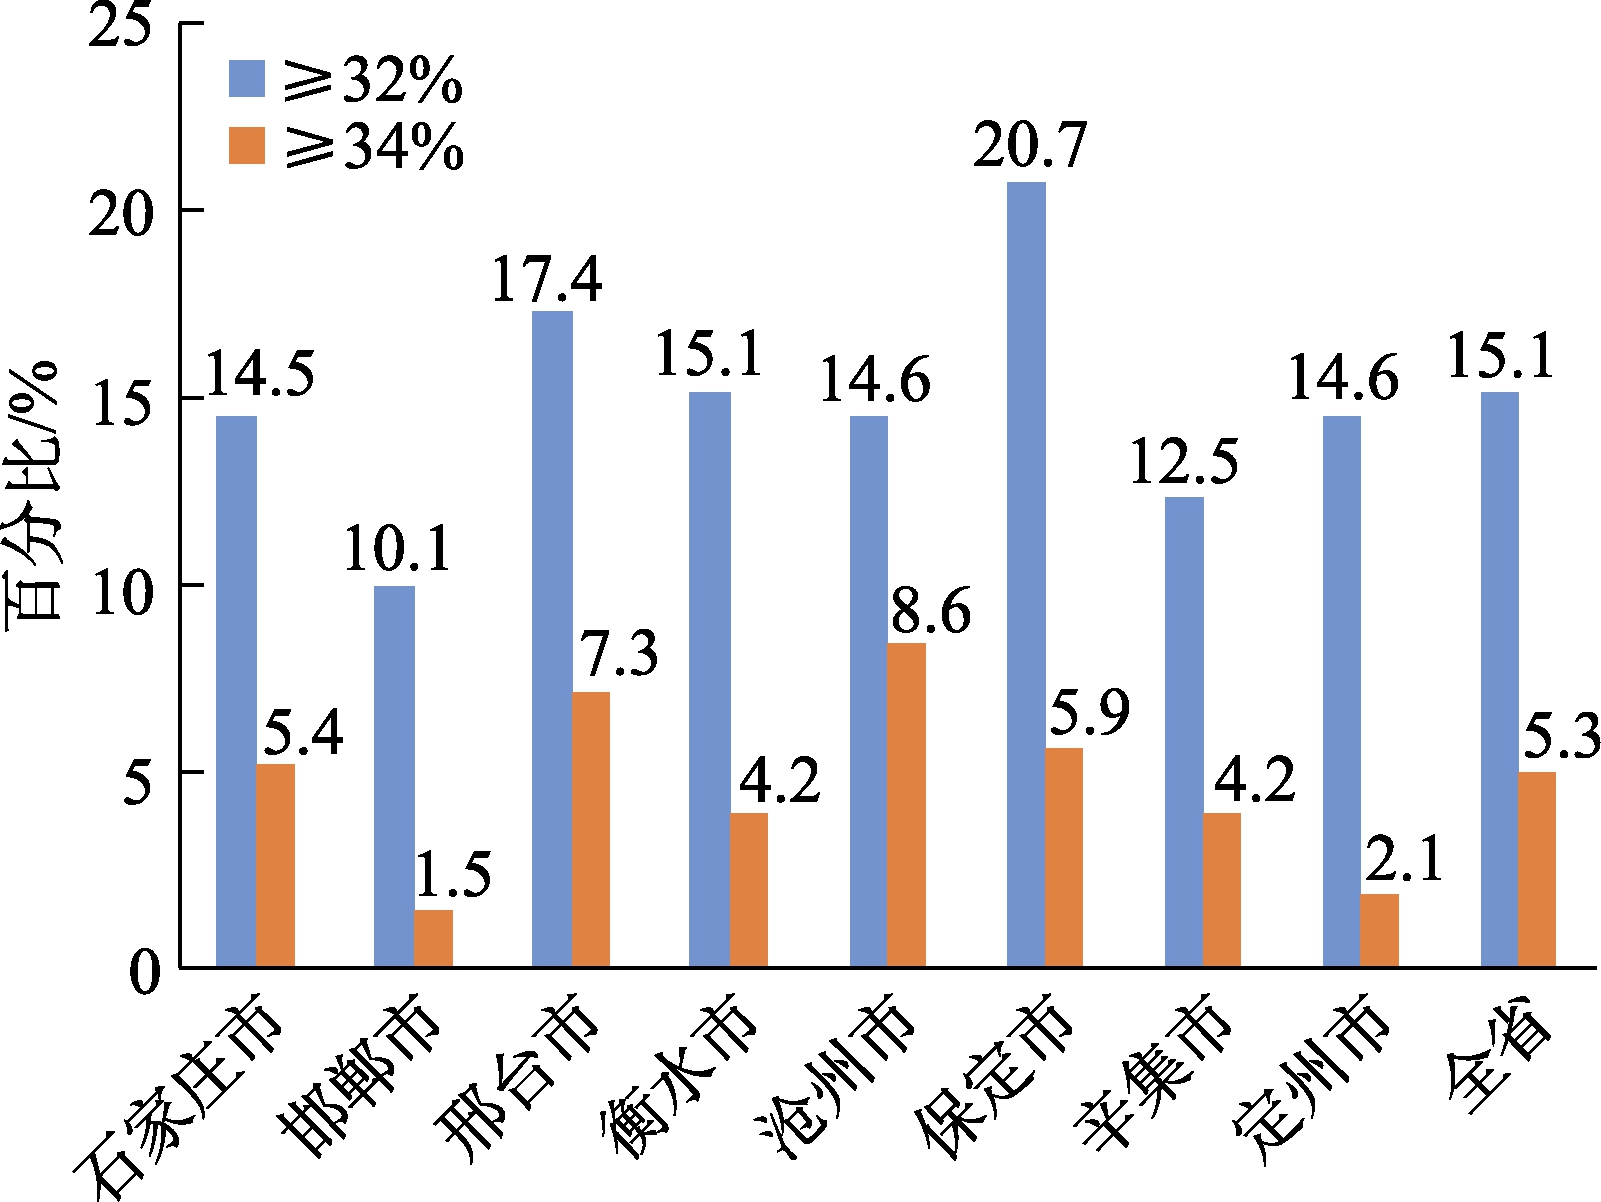
湿面筋含量在 32.0%以上的小麦,保定市、邢台市占比较高均大于17%,邯郸市占比最低为10.1%。34.0%以上的小麦,沧州市、邢台市、保定市占比较高均大于 5.8%,邯郸市占比最低为1.5%。邢台市、保定市在高湿面筋含量上有明显比较优势,如图5。

图5 高湿面筋含量占本市样本百分比比较
Fig.5 Percentage comparison of samples with high-gluten content in this city
2.3.6 各市高蛋白质含量样品份数比较
蛋白质含量在 14.0%以上的小麦,定州市、石家庄市的占比高达40%以上,邯郸市的占比最低为 25.3%。蛋白质含量在 15.0%以上的石家庄市、邢台市占比较高均在8.0%以上,定州市、邯郸市、保定市占比较低,均低于4.5%。石家庄市在高蛋白质含量上有明显比较优势,如图6。

图6 高蛋白质含量占本市样本百分比比较
Fig.6 Percentage comparison of samples with high-protein content in this city
3 结论
通过以上对2010年至2019年小麦质量监测数据的统计分析,结果表明:小麦质量情况除2013年、2018年外均为正常年景。2013年的小麦质量是十年之中最差的,小麦的容重、千粒重、降落数值均处于十年中的最低值,不完善粒含量及生芽粒含量、水分则处于十年中的最高值。
通过各市检测指标的比较,结果表明:在近十年的数据中,辛集市的小麦在高容重、高千粒重、低不完善粒含量、高硬度指数方面都有着明显的比较优势。另外邯郸市、邢台市、石家庄市的小麦在高容重方面有着明显的比较优势。
[1]小麦:GB1351—2008[S].北京:中国标准出版社,2008.Wheat:GB1351—2008[S].Beijing:Standards Press of China,2008.
[2]粮油检验容重测定:GB/T 5498—2013[S].北京:中国标准出版社,2013.Inspection of grain and oils—Determination of test weight:GB/T 5498—2013[S].Beijing:Standards Press of China,2013.
[3]谷物与豆类 千粒重的测定:GB/T 5519—2008[S].北京:中国标准出版社,2018.Cereals and pulses—Determination of the mass of 1000 grains:GB/T 5519—2008[S].Beijing:Standards Press of China,2008.
[4]粮油检验粮食、油料的杂质、不完善粒检验:GB/T 5494—2008[S].北京:中国标准出版社,2008.Inspection of grain and oils—Determination of foreign matter and unsound kernels of grain and oilseeds:GB/T 5494—2008[S].Beijing:Standards Press of China,2008.
[5]粮油检验 小麦水分含量测定 近红外法:GB/T 24898—2010[S].北京:中国标准出版社,2010.Inspection of the grain and oils—Determination of moisture content in wheat-Near-infrared method:GB/T 24898—2010[S].Beijing:Standards Press of China,2010.
[6]小麦硬度测定 硬度指数法:GB/T 21304—2007[S].北京:中国标准出版社,2007.Determination of wheat hardness-Hardness index method:GB/T 21304—2007[S].Beijing:Standards Press of China,2007.
[7]小麦、黑麦及其面粉,杜伦麦及其粗粒粉 降落数值的测定Hagberg-Perten法:GB/T 10361—2008[S].北京:中国标准出版社,2008.Wheat,rye and respective flours,durum wheat and durum wheat semolina—Determination of the falling number according to Hagberg-Peten:GB/T 10361—2008[S].Beijing:Standards Press of China,2008.
[8]小麦和小麦粉面筋含量第 2部分:仪器法测定湿面筋:GB/T 5506.2—2008[S].北京:中国标准出版社,2008.Wheat and wheat flour-Gluten content-Part 2:Determination of wet glutten by mechanical means:GB/T 5506.2—2008[S].Beijing:Standards Press of China,2008.
[9]粮油检验 小麦粗蛋白质含量测定 近红外法:GB/T 24899—2010[S].北京:中国标准出版社,2010.Inspection of grain and oils-Determination of crude protein in wheat-Near-infrared means method:GB/T 24899—2010[S].Beijing:Standards Press of China,2008.
[10]姜友军,杨超,付爱华,等.生芽粒对小麦降落数值变化规律的研究[J].粮食储藏,2018(4):27-30.JIANG Y J,YANG C,FU A H,et al.Study on the change rule of wheat falling number caused by sprouted kernel[J].Grain Storage,2018(4):27-30.